July 14, 2020
Is Data Science Just a Rebranding of Statistics?

DURATION
5 mincategories
Tags
share
Both Data Scientists and Statisticians ingest data and extract information. Some would argue that there are differences in terms of their usage. However, when data science and statistics are used together they form a powerful partnership.
Before we get into the technical inner workings of both the fields, let’s look into their definitions and find the similarities and dis-similarities according to their usage.
What is statistics?
Statistics is one of the best ways to get information from numerical data. It’s used to estimate or measure a parameter. The important role of statistics is to represent unstructured data in the form of tables, graphs, and charts. We can combine two columns of data (for example, date and passenger count) in a single chart to show the structural way.
Mathematicians very often play with numerical data to calculate mean and variance. Finally, they can make decisions based on the plots, charts, or tables.
What is data science?**

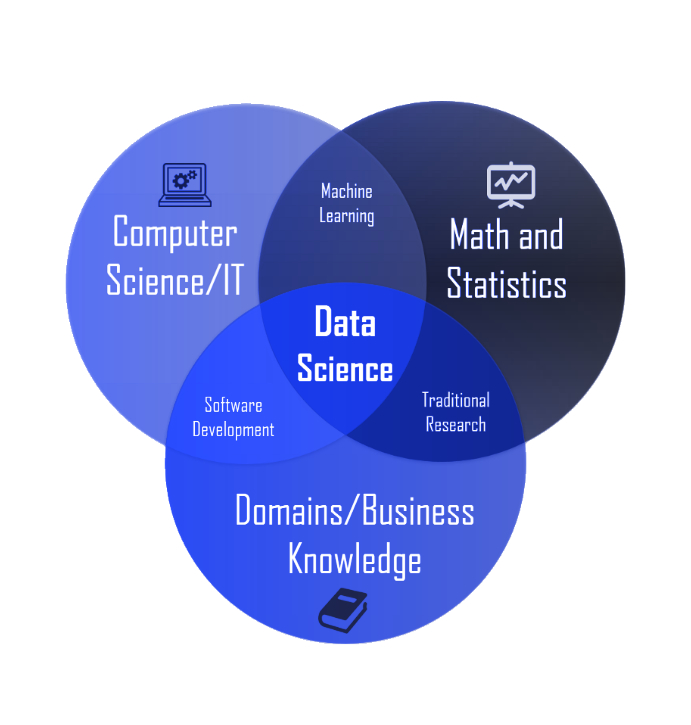
Data science is an umbrella term for machine learning, deep learning, computer vision, and natural language processing. When we have huge amounts of data, data scientists will convert it into useful content, which means they will perform all kinds of processing using algorithms and maths formulas. A data scientist will look at the data from many perspectives, sometimes uncovering data which was not known earlier. Frequently after performing some operation they will find out other inside meanings.
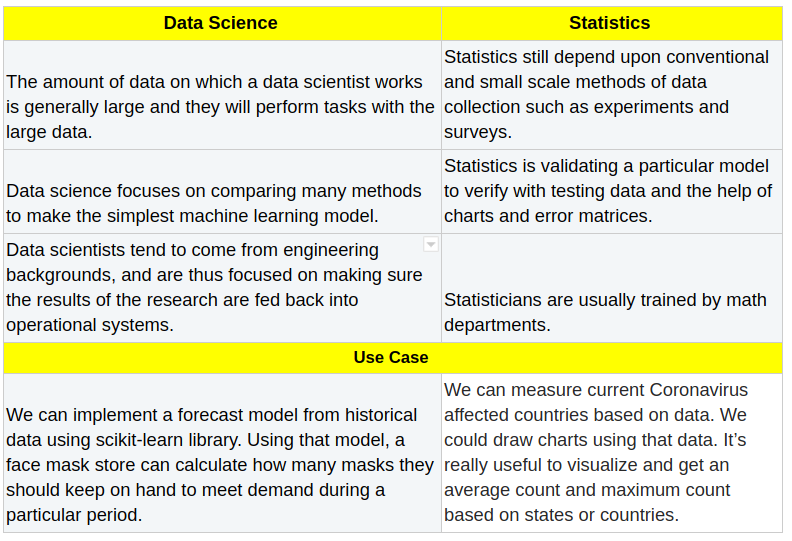
So how are they different?

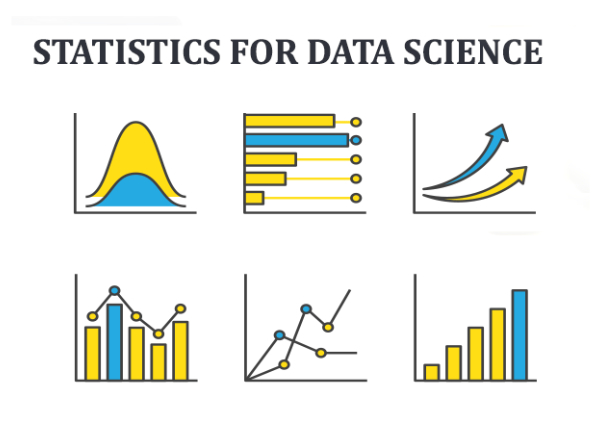
What is the important role of statistics in data science?
Statistics has a major role to play in data science. Let’s find out about it.
Let us take a look at the process of solving a problem using data science:
Define the problem
Identify the required data
Prepare and pre-process
Model the data
Train and test
Verify and deploy

As you see in the steps mentioned above, for the third (3rd) step we can use programming to preprocess data, and then we can use a library like Seaborn to show charts for various visualizations.
Visualizations are an important aspect of the whole data science process. Although data science has a lot of tools available for visualization, complex representation requires some extra coding to visualize the data.
Interestingly, Seaborn tags itself as a statistical visualization tool so yes, statistics is one of the major parts of the data science field and helps us get better results from data.
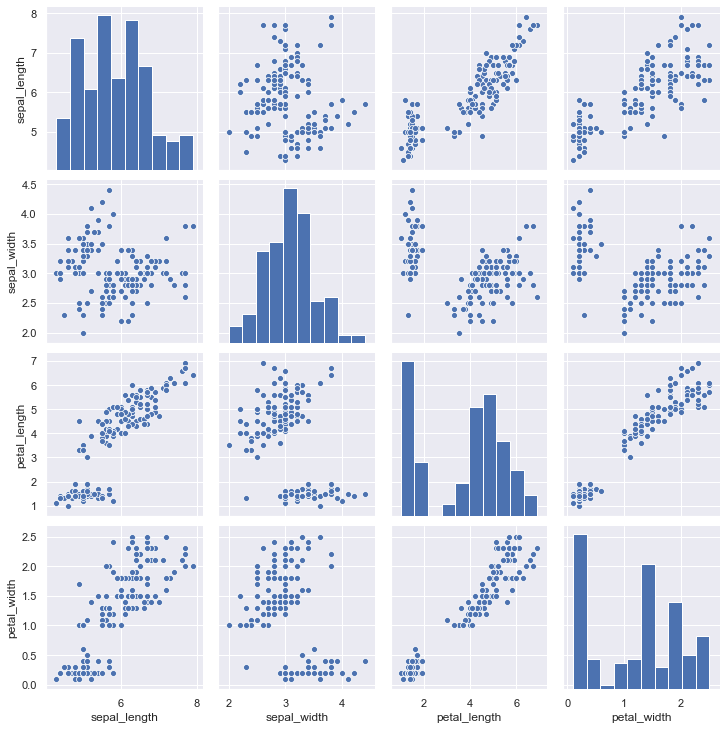
For instance, you can use the pairplot() function of the Seaborn library. This creates a matrix of axes and shows the connection for every pair of columns during a DataFrame.
I have used the IRIS dataset for the plot.
1 2 3import seaborn as sns iris = sns.load\ _dataset("iris") sns.pairplot(iris);

Why do developers often confuse statistics with data science?
Some specializations of data scientists:
mathematical modeling,
visualization,
algorithms (i.e. data mining, machine learning),
business uses of data (modeling decision, designing data communications).
If you think about all those things as branches of statistics then you could say data scientists are statisticians. Statistics is also one of the areas in the data science field.
Conclusion
There’s nothing wrong with rebranding and it’s great if it gets more industries involved.
In conclusion, I believe that when statistical research is combined with programming then it is data science, or when the results of the research are fed back into operational systems then it is data science.